Searching Data
The Search section of the accordion menu allows users to search phenotype, genotype, and cross data depending on the data in the program. Click on the "Search" section of the left side accordion menu and then click on "Phenotype" (Fig. 10A). This will open the "Search by Phenotype" tab (Fig. 10B). This guide explains only the phenotype search. A similar procedure is used for genotype search, but in genotype search, the genotypic file created can be downloaded from the User Account Page (top right corner beside the user icon).
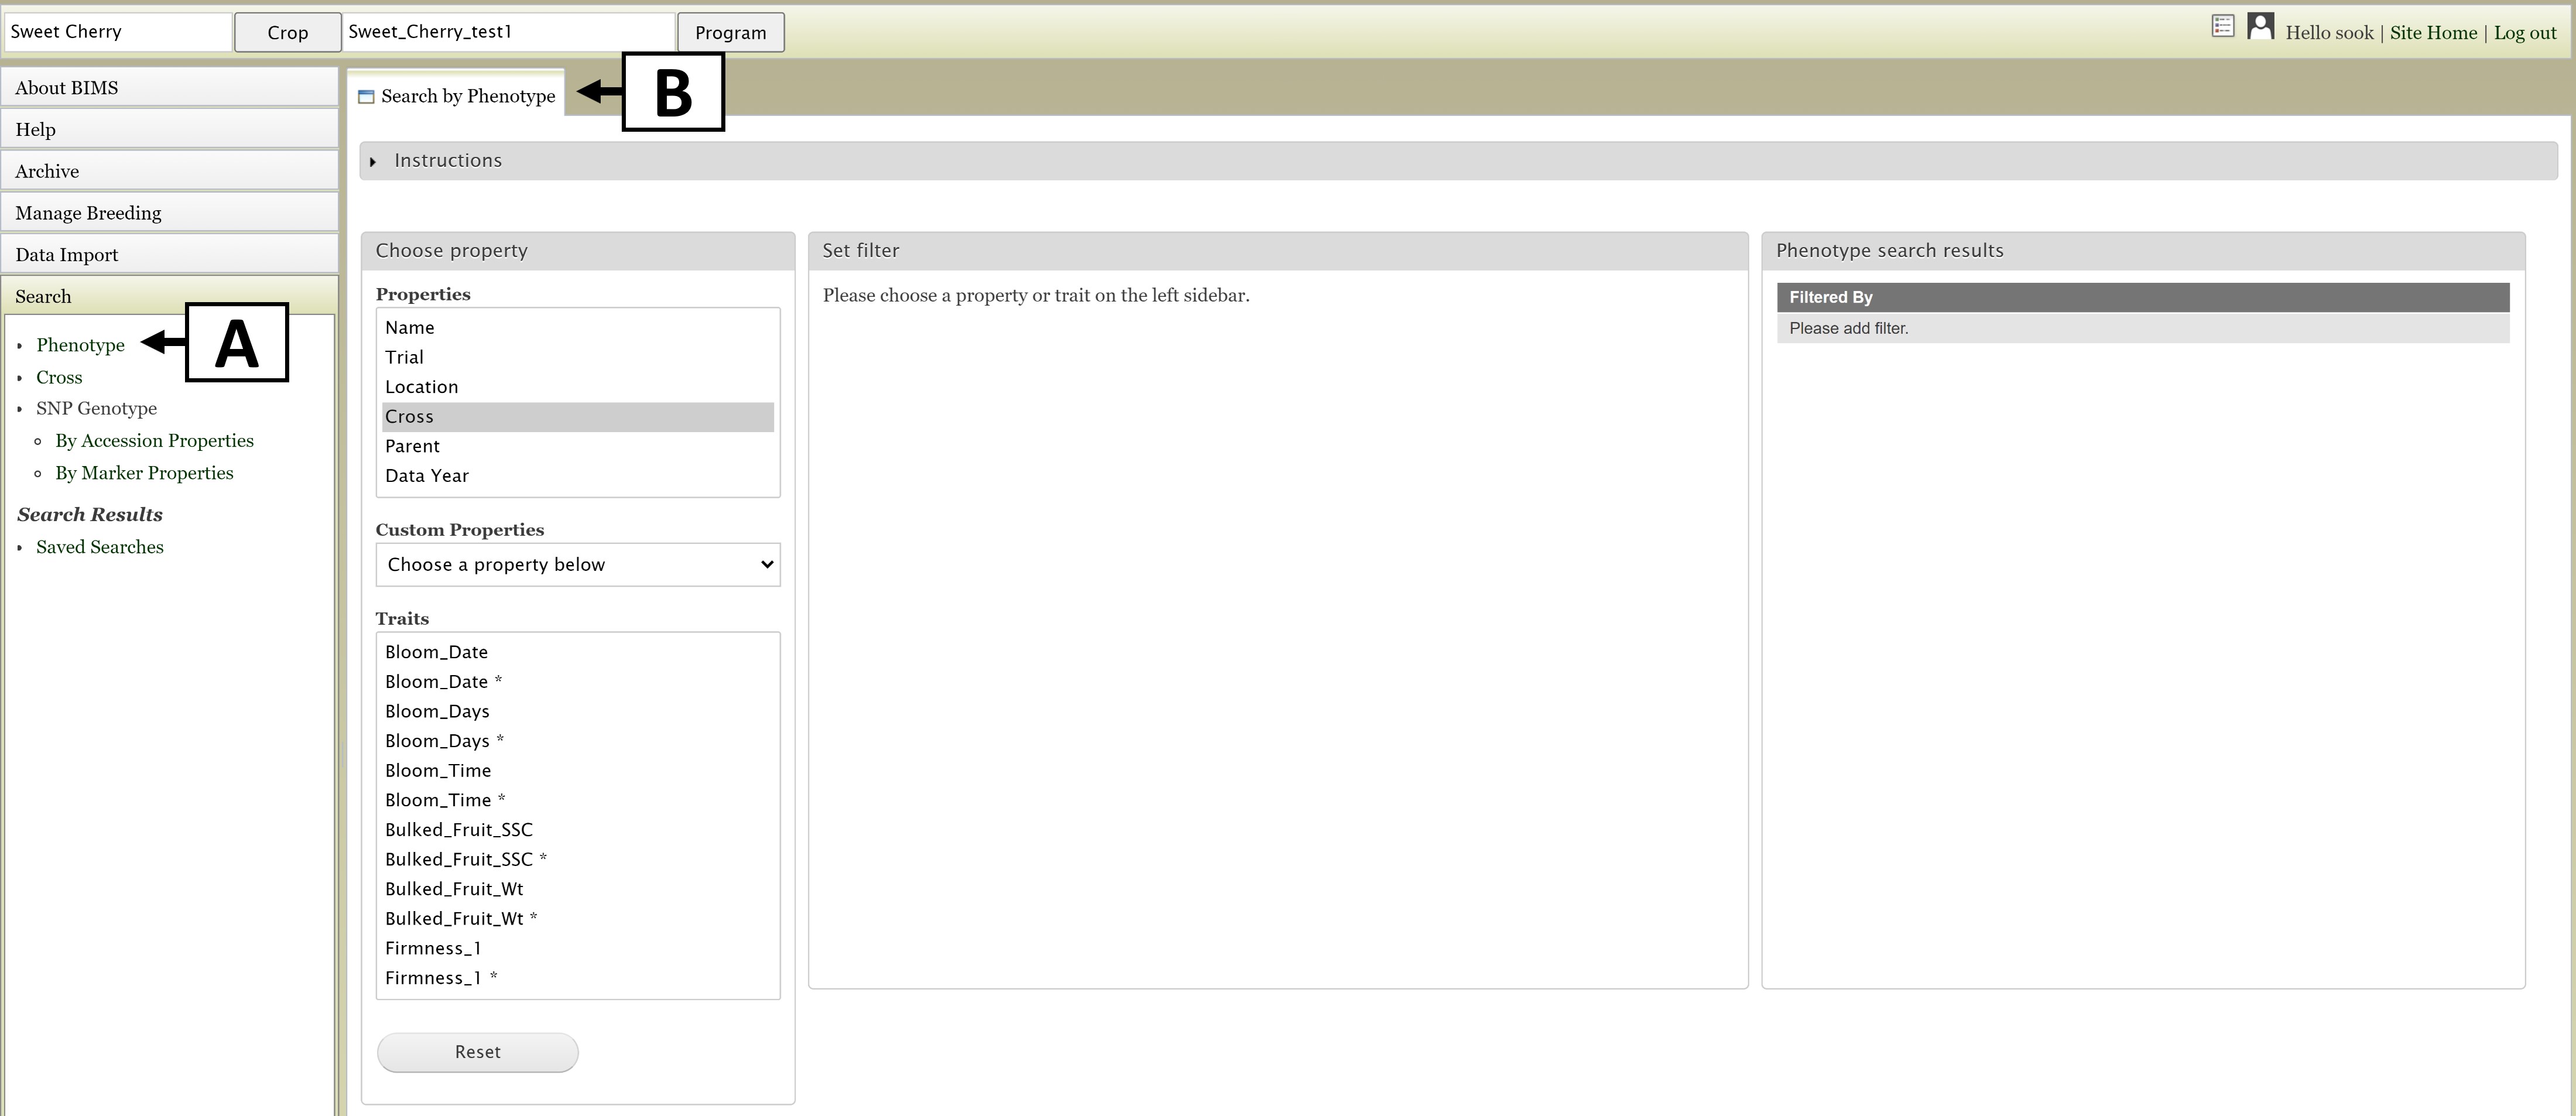
Figure 10. Opening the Search tab.
The first step to start a search is to select a property or trait under the "Choose property" section (Fig. 11A). In this example, we are choosing "Parent." After the property is selected, the "Set filter" section will populate with options for that data type (Fig. 11B). After selecting the options you want, click "Add." The selected filter will then appear in the "Search results" section (Fig. 11). If you want to reset the search, click the "Reset" button (Fig. 11C).
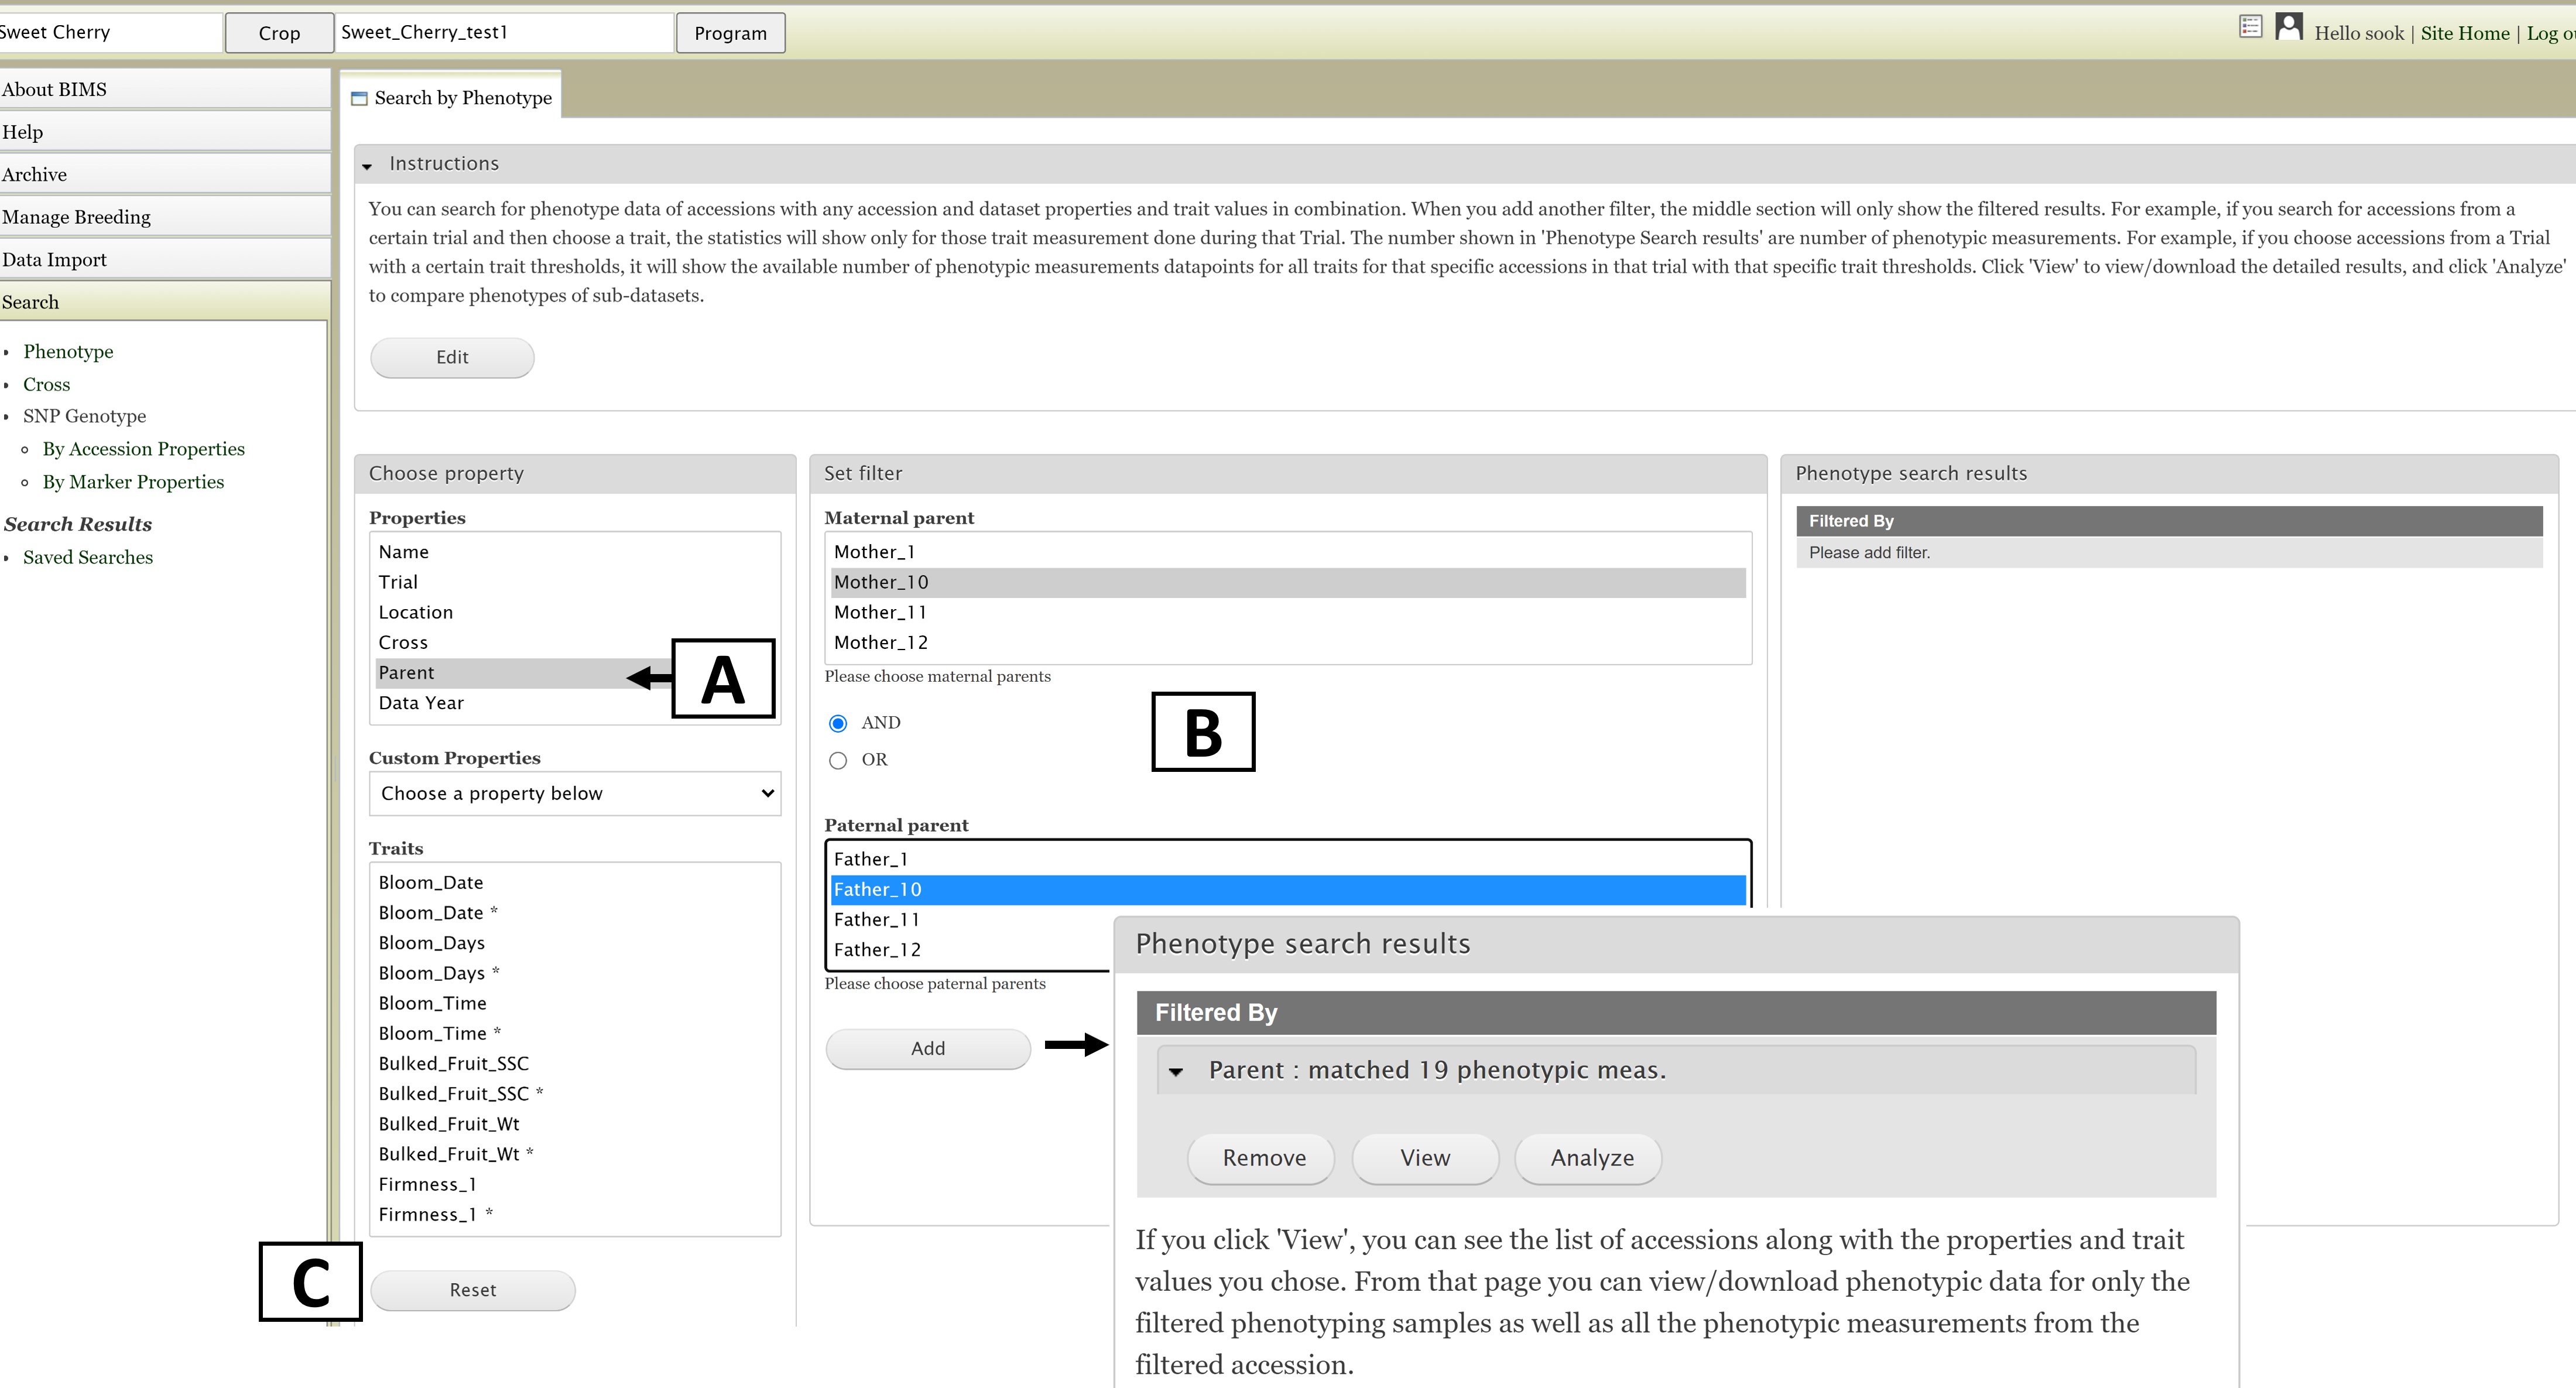
Figure 11. Selecting a Property and setting a Filter in the Search Tab.
You can further filter the search results by adding another property or trait under the "Choose property" section. In this example, we are further refining the search by adding the Fruit Shape trait (Fig. 12A). The "Set filter" section will show the data that are relevant for the previous filter you chose. For example, the statistics shown for Fruit Shape trait here is only for those accession from the parents you chose in the previous search. You can set the minimun and maximum value of this trait, and then click "Add" (Fig. 12B). The new filter is added to the "Search results" section and the selected filters can be removed with the "Remove" button under "Search results" (Fig. 12C). To view the search results, and to generate a file to export, click on "View" under "Search results" (Fig. 12C).
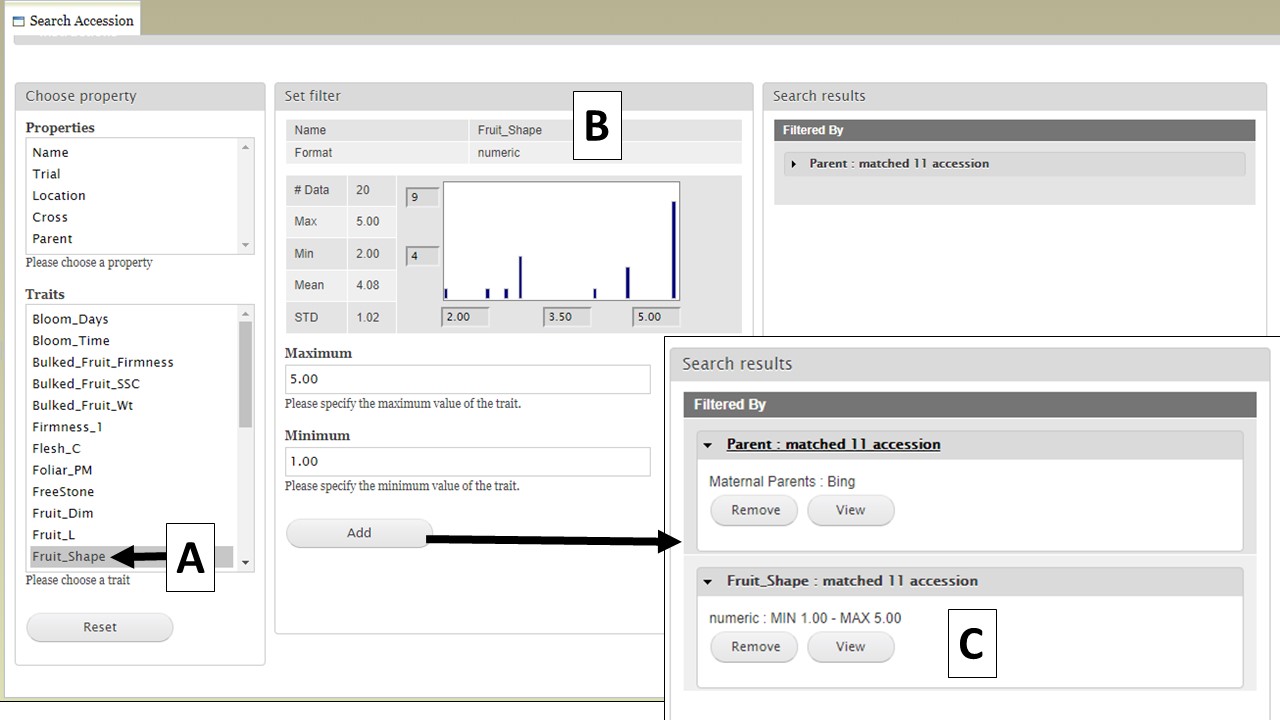
Figure 12. Adding more filters to the search and viewing results.
When the "View" button is clicked (Fig. 12C), a new tab opens called "Search Results" (Fig. 13). On this tab there is a "Column options" section (Fig. 13A) and a preview of the data table (Fig. 13B).
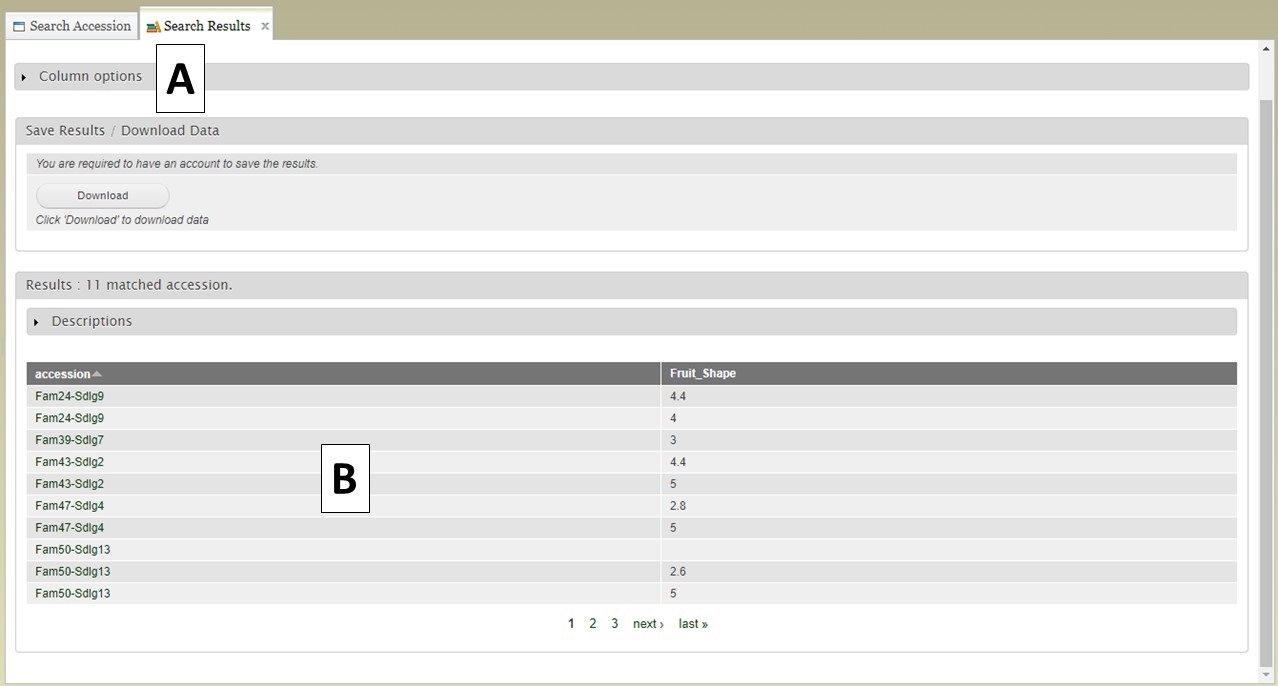
Figure 13. Search Results tab.
Users can add more information to the table before exporting the data. To do this, click on the "Column options" section to expand it (Fig. 14). There are two sections, "Properties" (Fig. 14A) and "Traits" (Fig. 14B). You can select additional items to display by clicking on the check boxes in these two sections. Once all the selections have been made, click "Update" (Fig. 14C).
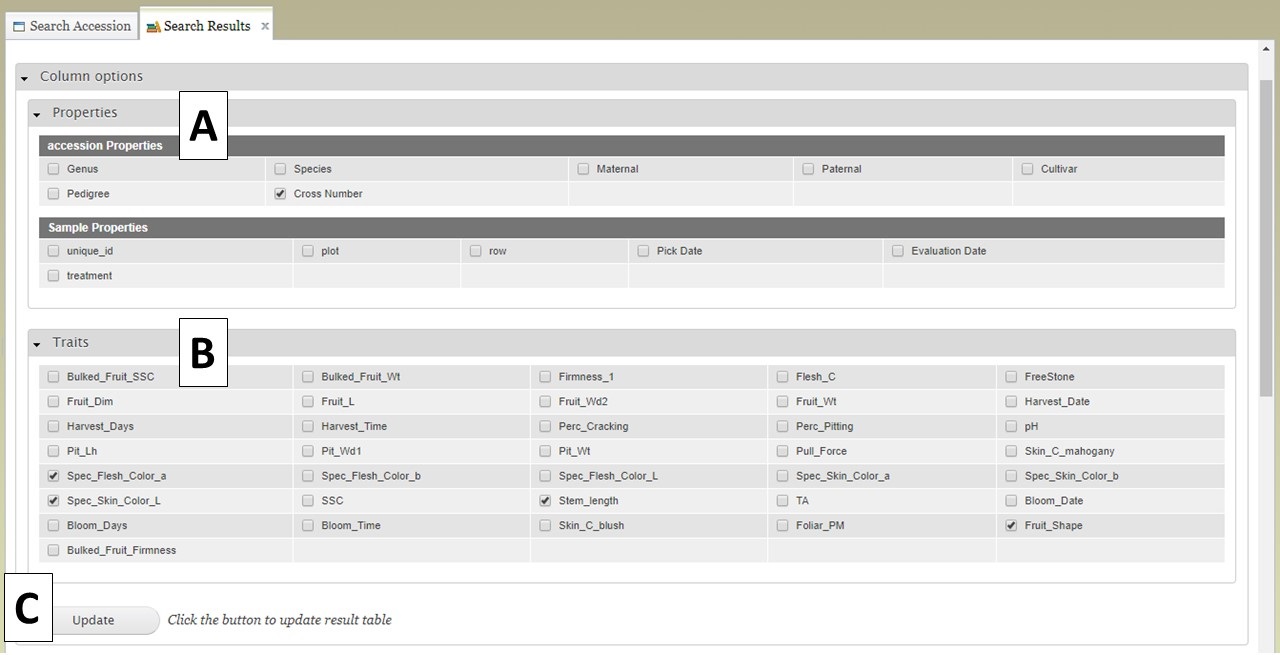
Figure 14. Adding more columns to search results table with Column Options section.
After selecting additional data to display on the table, you can preview the table on the "Search Results" tab (Fig. 15A) and see the original filters that were used to generate the initial table by clicking on "Descriptions" in the "Results" section (Fig. 15B). To download the data table, click on the "Download" button in the "Save Results / Download Data" section (Fig. 15C). If you do not see your browser start to downoad the file after clicking "Download," please make sure the pop-up was not blocked.
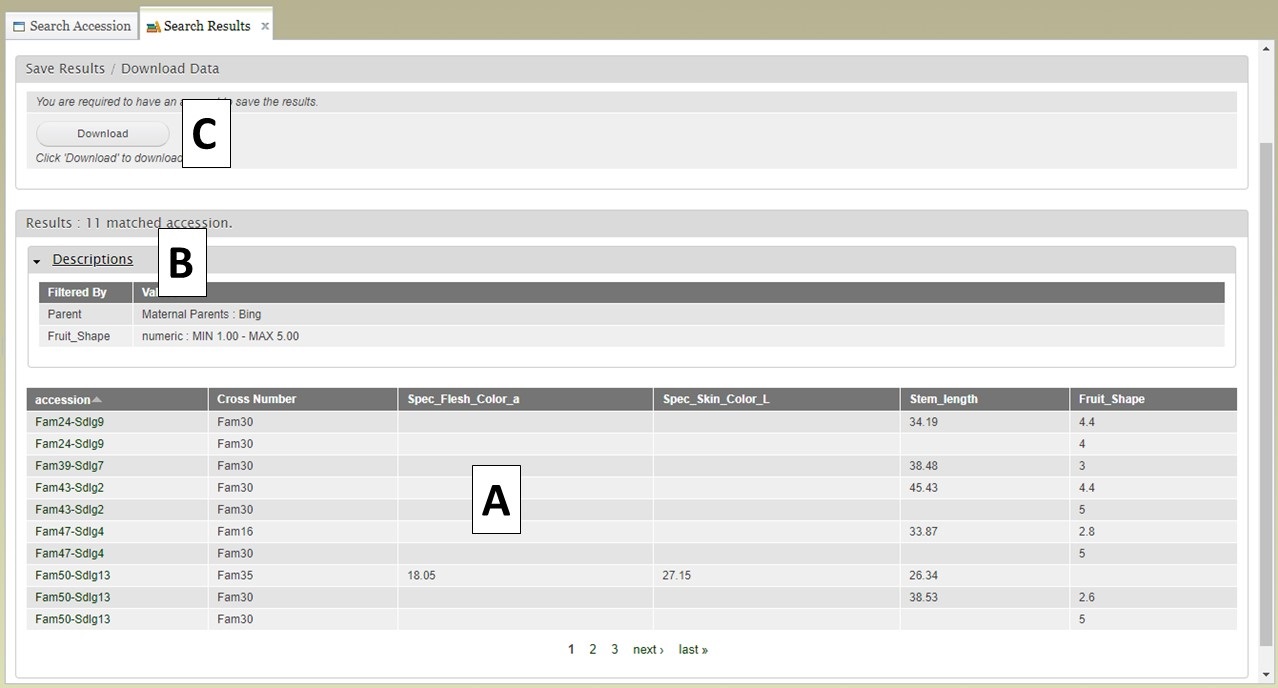
Figure 15. Downloading data from the Search Results tab.
BIMS generates a CSV file of the search results table (Fig. 16). This table is easily opened by Microsoft Excel and other programs.
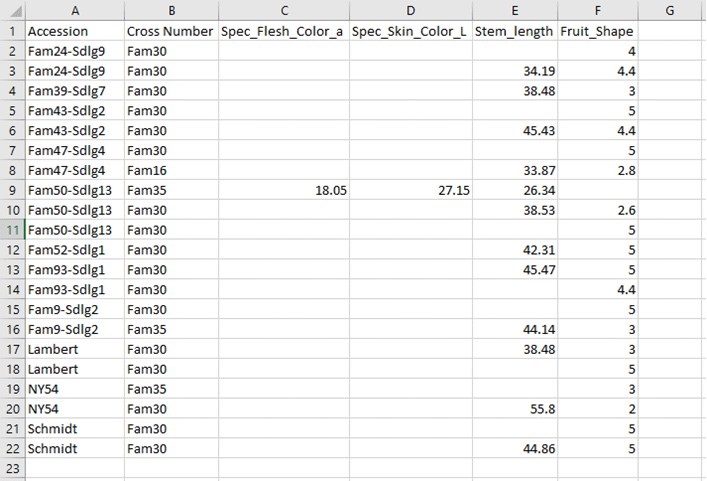
Figure 16. Example CSV file exported from BIMS.
If you have a GDR account, you can also save the search results to a list. You will see a "Save" button with boxes for a list name and description (Fig. 17A). This list will be saved to your program or to public program that you are in and accessed by clicking on "Search Results" in the "Search" section of the accordion menu (Fig. 17B). You can also see details about the saved lists and delete, view, or edit them (Fig. 17C).
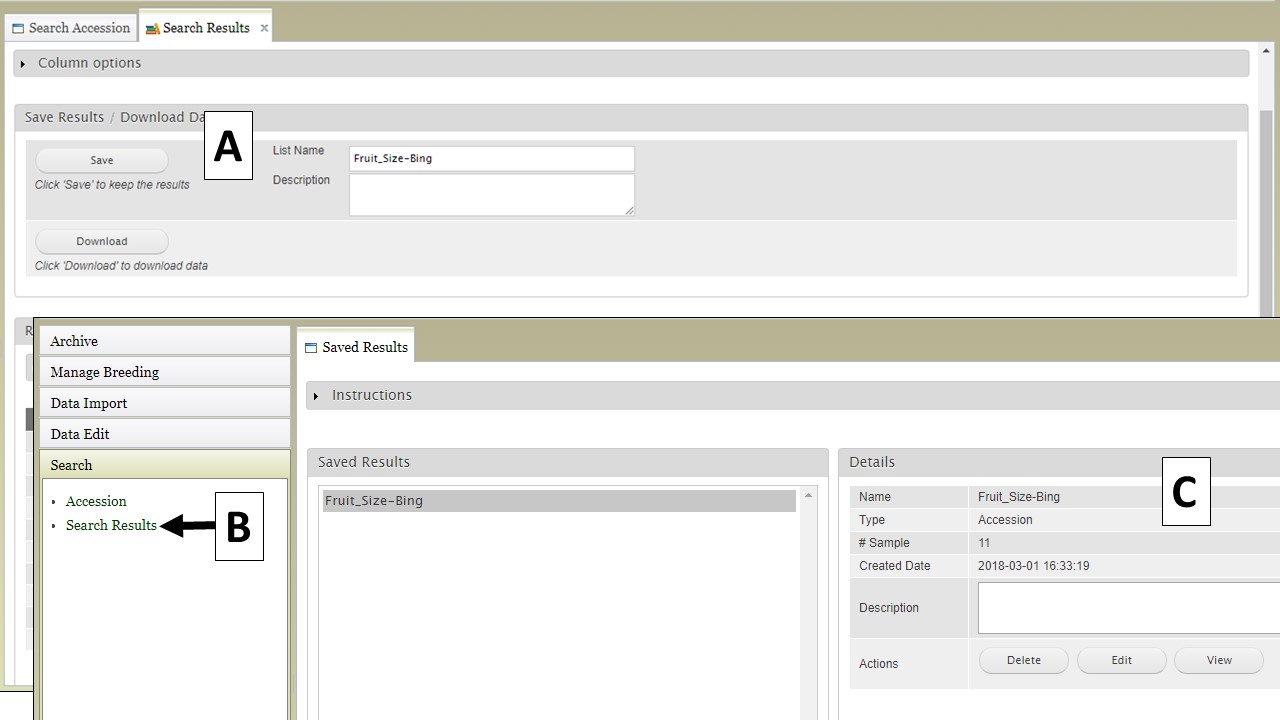
Figure 17. Saving lists from searches to private breeding programs.